


Correlations of T2* Mapping with delayed gadolinium enhancement in magnetic resonance imaging of chronic myocardial infarction
Background:
Scar tissue formation is a common phenomenon in myocardial infarctions. Contrast-enhanced cardiac magnetic resonance imaging is the modality of choice to evaluate the location and size of the scar tissue. Nevertheless, in patients with severe kidney impairment, administration of gadolinium is contraindicated.
Objectives:
So the aim of this study was to substitute a safe way for myocardial infarction assessments in patients with a history of renal function impairment. We assessed the T2* quantitative value changes in myocardial infarction-related scar tissue and compared them with normal/remote myocardial tissue T2* values to evaluate its application in non-contrast cardiac magnetic resonance imaging viability assessments.
Patients and Methods:
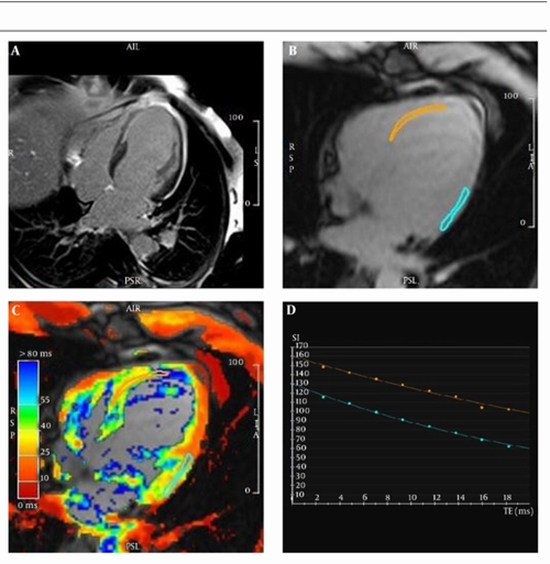
Twenty patients with a previous history of non ST-elevation myocardial infarction (NSTEMI) underwent cardiac magnetic resonance (CMR) examination with a 1.5T MR imaging scanner (Avanto, Siemens AG Healthcare Sector, Erlangen, Germany). The time interval between myocardial infarction occurrence and CMR assessment was at least six months. All the patients had normal kidney function. The imaging protocol consisted of three steps: the functional left-ventricular imaging; 8-echoes gradient recalled echo T2* mapping; and delayed/late gadolinium-enhancement imaging. The left-ventricle functional and T2* mapping assessments were done by CMR42 image analysis software (Circle Cardiovascular Imaging, Calgary, Canada). T2* values were calculated for 49 regions of interests (ROIs) at the infarction (14 ROIs), peri-infarction (12 ROIs), and remote/normal myocardial tissues (23 ROIs), and their means were compared statistically by the Leven’s test. Finally, the receiver operator characteristics curve was calculated.
Results:
T2* (mean ± SD) values of the normal/remote, peri-infarction, and infarcted myocardial tissues were calculated as 29.42 ± 4.50, 30.71 ± 4.86, and 35.46 ± 3.61, respectively. There was a significant alteration in the post-infarction scar tissue’s myocardial T2* values by comparison with the normal/remote myocardium (P < 0.001). No significant differences were noticed between the normal/remote and peri-infarction regions’ T2* relaxation times (P > 0.05). Area under the curve was 81% for patients evaluated for scars. Cutoff value of 31.70 yielded 92% sensitivity and 72% specificity.
Conclusion:
T2* relaxation time can provide useful and sensitive information on scar tissue formation location, and can offer a greater sensitivity into the non-contrast CMR imaging viability assessments besides other relaxation phenomena, especially the longitudinal relaxation time.


Send to friends