


Exploring the interplay between epicardial fat, coronary artery calcium score, and nonalcoholic fatty liver disease through non ECG gated chest computed tomography: A cross sectional study
Background and Aims
This study examines the relationships between epicardial adipose tissue (EAT), nonalcoholic fatty liver disease (NAFLD), and coronary artery calcium score (CACS) using non‐ECG‐gated CT scans. It aims to determine the effectiveness of EAT measurements and NAFLD as predictors for coronary artery disease (CAD).
Methods
This cross‐sectional study was conducted at a specialized center, focusing on individuals who underwent non‐ECG‐gated chest CT scans without contrast. We evaluated EAT thickness and density in three areas: the right atrioventricular groove, the free wall of the right ventricle, and the central area of the right anterior interventricular groove. Additionally, we measured CACS and determined the presence of NAFLD by comparing liver‐to‐spleen density ratios. Statistical analyses, including regression models, were performed using SPSS (version 26).
Results
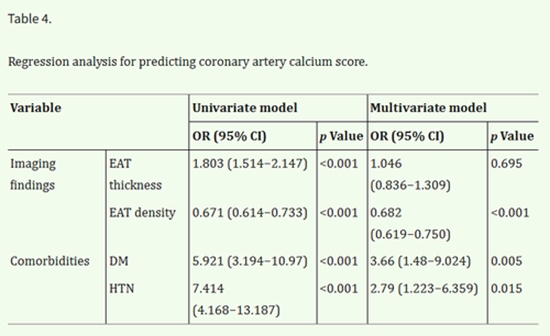
In this study, we enrolled 365 participants, including 203 males with an average age of 47 ± 17.93 years. EAT thickness was 6.28 ± 1.62 mm, and EAT density was −96.07 ± 12.47 Hounsfield units (HU). The mean CACS was 22.27 ± 79.01, and the mean liver density was 50.01 ± 10.76 HU. A significant positive correlation was observed between EAT thickness and CACS (r = 0.208, p < 0.001). EAT density showed a significant negative correlation with CACS (r = −0.155, p = 0.003). No correlation was found between NAFLD and CACS. Univariate logistic regression analysis identified significant predictors of increased CACS, including EAT thickness (OR: 1.803), EAT density (OR: 0.671), diabetes mellitus (DM) (OR: 5.921), and hypertension (HTN) (OR: 7.414). Multivariate analysis confirmed the significance of EAT thickness (OR: 0.682), DM (OR: 3.66), and HTN (OR: 2.79) as predictors of elevated CACS.
Conclusion
Our findings demonstrate that increased EAT thickness and decreased density are associated with higher CACS. Also, both DM and HTN significantly contribute to increased CACS. These results support the inclusion of EAT measurements in cardiovascular risk assessment models to enhance diagnostic accuracy.


comment